Injury Reports vs. Line Movements
Learn how to combine injury reports and line movements to spot mispriced odds, reverse line movement, and exploit public overreactions in sports betting.
Learn how to combine injury reports and line movements to spot mispriced odds, reverse line movement, and exploit public overreactions in sports betting.
Professional bettors turn historical stats, situational context, and calibrated models into systematic edges to spot mispriced bets and improve ROI.
Use WPA, clutch shooting splits, free-throw accuracy and turnover rates to spot late-game betting edges, with historical backtesting and WagerProof tools.
Why expected ROI and actual ROI often diverge in sports betting — learn how variance, sample size, CLV, model limits, and bankroll rules affect results.
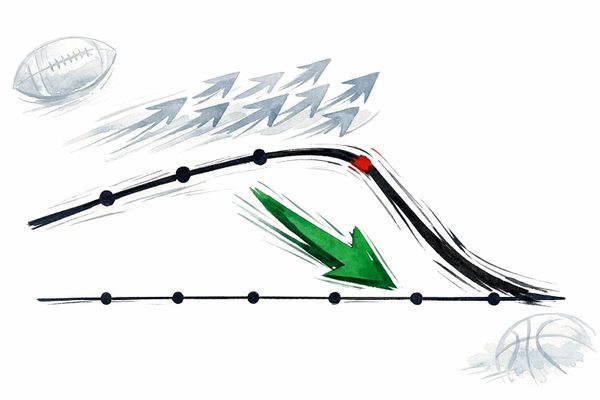
Learn to read line movement and spot reverse line movement to separate public bets from sharp money in sports betting.
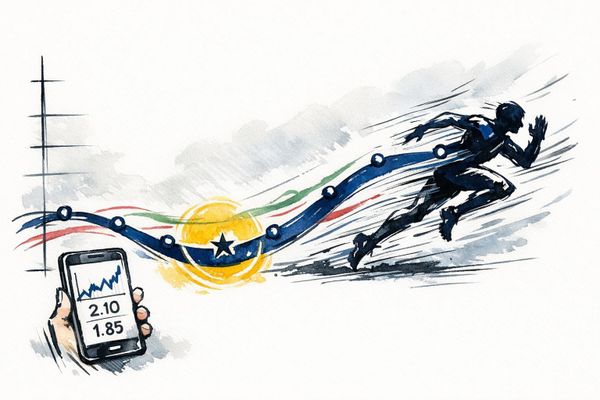
Time series models and real-time odds tracking reveal market inefficiencies, improve predictions, and help spot value bets in sports betting.
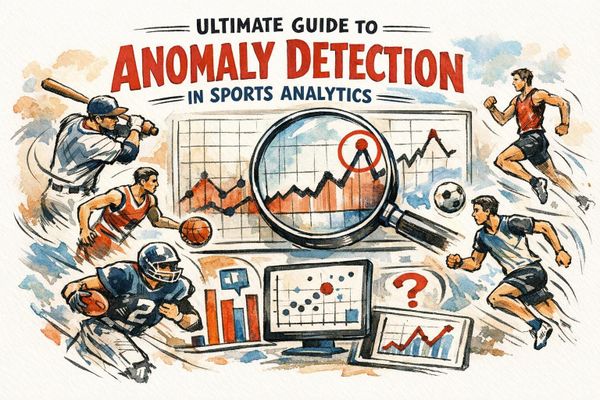
Anomaly detection is the competitive edge in sports analytics — use statistics and ML to spot fatigue, performance regression, and betting fraud in real time.
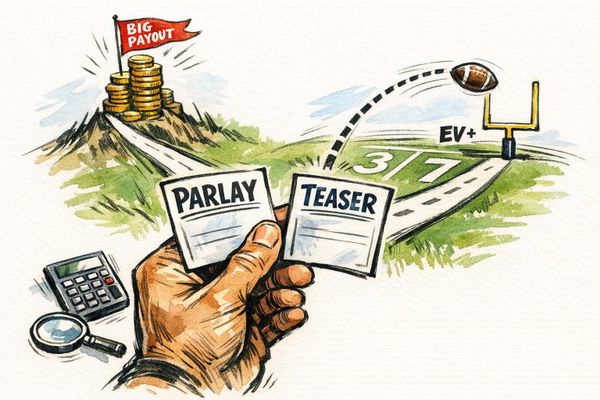
Parlays offer big payouts but high house edge; teasers can win when crossing NFL key numbers—use EV, break-even rates, and line shopping to decide.
How AI uses wearable biometric and historical data to predict athlete injuries up to 48 hours ahead, affecting team strategies and betting odds.

Combine split-second timing with market-movement analysis to find live betting value, manage risk with EV/LEV, and act on odds delays.
Use ticket vs. money percentages, reverse line movement, and real-time tools to spot sharp action and uncover undervalued betting lines.

Learn the ROI formula for sports betting, how to track wagers and returns, plus examples, benchmarks, and tools to measure profitability.