
Public Money Data: Finding Undervalued Lines
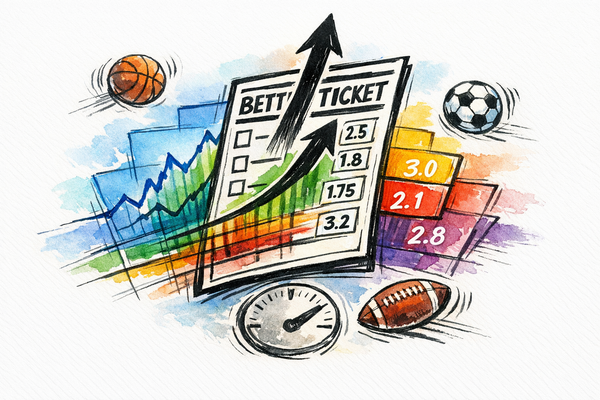
Use ticket vs. money percentages, reverse line movement, and real-time tools to spot sharp action and uncover undervalued betting lines.
Use ticket vs. money percentages, reverse line movement, and real-time tools to spot sharp action and uncover undervalued betting lines.

Learn the ROI formula for sports betting, how to track wagers and returns, plus examples, benchmarks, and tools to measure profitability.
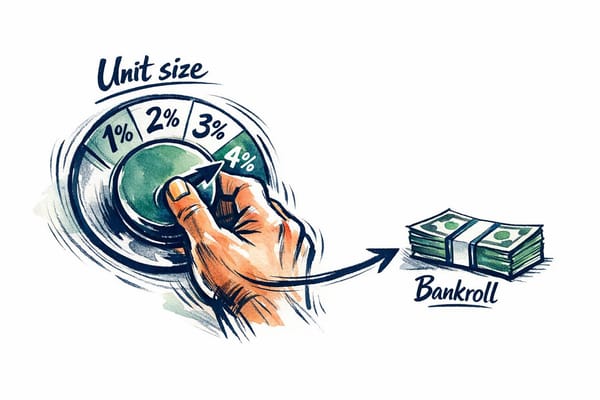
Set your fixed betting unit as a percentage of your bankroll, choose 1–5% based on risk tolerance, and adjust units as your bankroll changes.
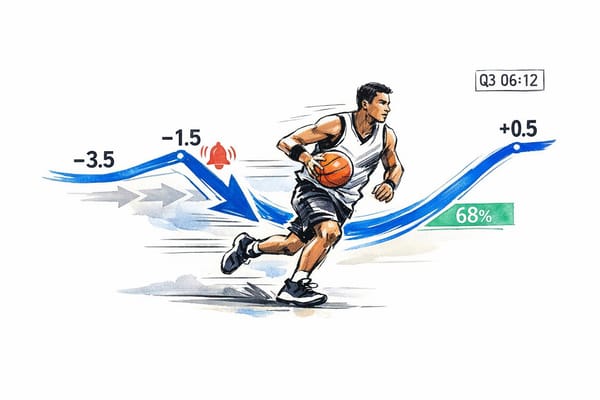
Monitor live spreads, set automated alerts, track money lean and reverse line movement, and use real-time tools to find +EV in-game betting opportunities.
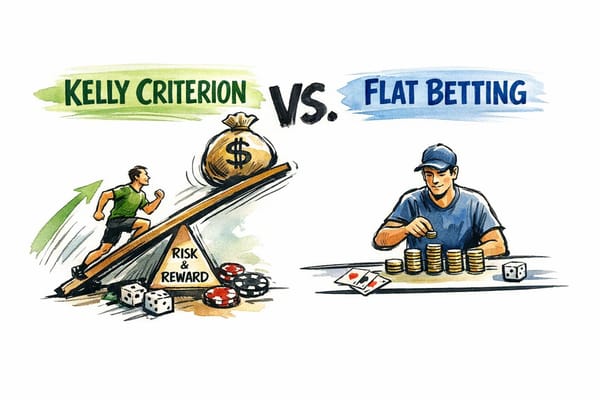
Kelly maximizes growth when you can estimate edge; flat betting preserves stability—choose based on data confidence and risk tolerance.
Combine diverse predictive models and z-score aggregation to find value bets, reduce risk, and improve ROI. Covers aggregation methods, Kelly sizing, and live-betting tools.

Correlation analysis exposes mispriced sports bets, turning overlooked negative correlations into a measurable edge over sportsbooks.
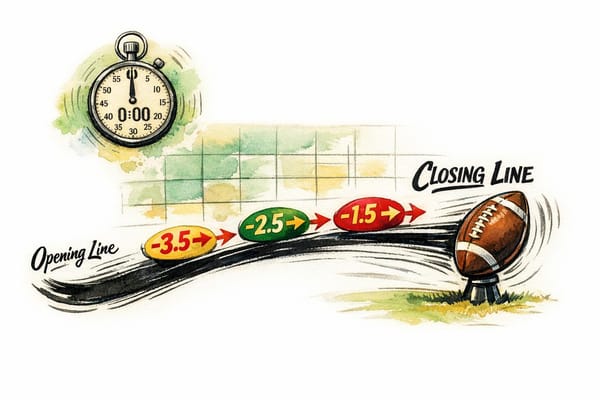
Learn how Vegas closing lines, CLV and RLM reveal market edges, improve predictive models, and help bettors spot value before kickoff.
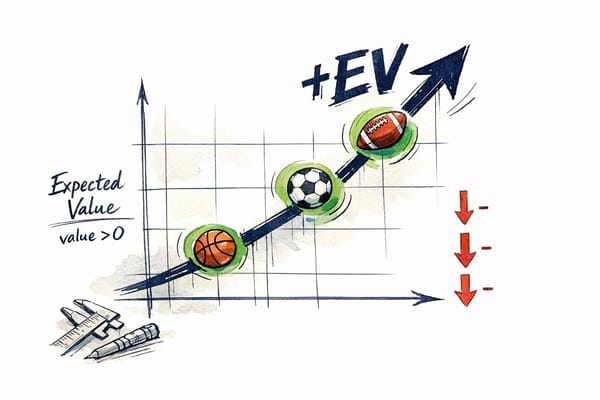
Calculate expected value, spot mispriced lines, and use automated tools to find +EV sports bets while applying disciplined staking for long-term profit.
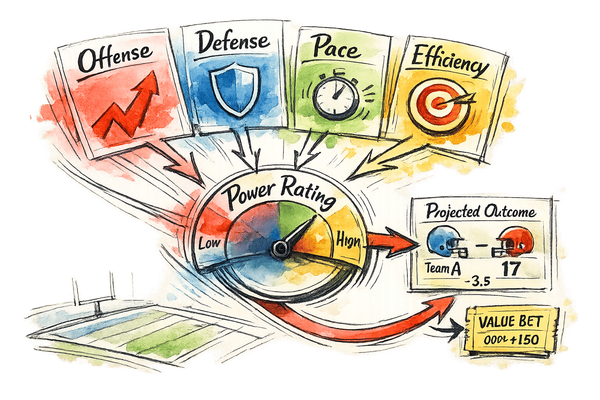
Use opponent-adjusted offensive and defensive metrics (EPA, DVOA, pace, efficiency) to build power ratings, project outcomes, and find value bets.
Flat betting favors steady, low-risk bankroll growth; percentage allocation uses compounding and greater volatility—choose by experience and risk tolerance.

Compare statistical models and machine learning for sports betting: data needs, interpretability, ROI, and why calibration + hybrid models deliver lasting gains.